USING THE DATA [home] [topic page]
With Landsat and SPOT, the three sets of measurements in the visible can be combined to give a combined red/green/blue image. This combined measurement is a "real" colour image of the ground and the picture appears very much as the view would to an astronaut.
Our eyes receptors are keyed to visualising in red/green/blue hues due to the 3 colour rhodopsins in the retina. Human eyes see strengths of these primary colours and the brain interprets them to be colours we see around us. ( Newton was the first to realise this, colour TVs and computer monitors make use of it to display full colour signals in the simplest fashion. They simoultaneously project 3 images onto the screen triggering three sets of colour emissions, red/green/blue! )
Use of only some of the colours can give a measure of health, especially when combined with other readings. Chlorophyll reflects green light but absorbs red and blue in the visible. This is why leaves look green. Healthy young growth will show strong absorption in red and blue measurements.
Reference to the animation showing radiation and Landsat bands shows that healthy growth will also register in bands 5 and 7 as will dry plants. However, the reflectance is significantly different. Dry plants reflect vastly more at these wavelengths so any strong readings in these bands must indicate a lack of growth.
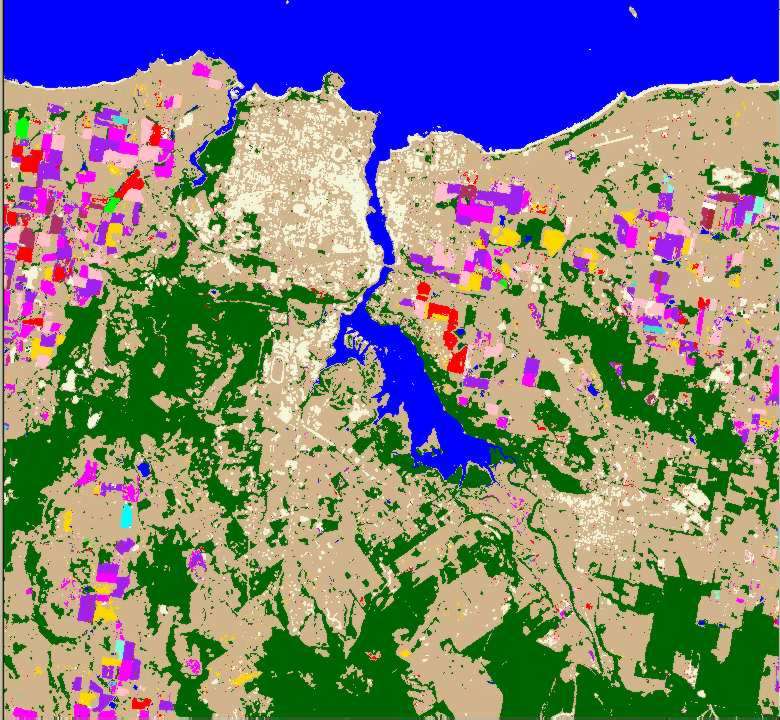
By giving the reflected radiation detected by the satellite a colour which depends on the strength, a "false colour" image is created. As the colours assigned are fairly arbitrary - computers do this easily, rather strange combinations are used to highlight the growth or otherwise of the crops. In the images shown, red shows high growth - a "weakish" signal in bands 5 and 7 as healthy plants reflect less at these wavelengths.
Other techniques looking at plant specifics can identify actual crops with good certainty. All plant colours are not the same even to the naked eye.